The National Travel Survey 2017 is a household survey of personal travel by residents of England travelling within Great Britain, from data collected via interviews and a one-week travel diary. The NTS is part of a continuous survey that began in 1988, following ad-hoc surveys from the 1960’s, which enables analysis of patterns and trends. Some key uses of the data include describing patterns, for example how different groups of people travel, monitoring trends in travel, including sustainable modes; assessing the potential equality impacts of transport policies on different groups; and contributing to evaluation of the impact of policies.
The National Travel Survey 2017 results have recently been published and the previous trend of a steady decrease in trip rates and miles travelled since the late 1990’s has changed. Between 2015 and 2017 there has been a slight increase. In addition to this, the long-term trends over the past 45-years show that the average distance travelled in increasing but on the other hand, the number of trips and time spent has stayed broadly the same.
Key points in the survey results show the following;
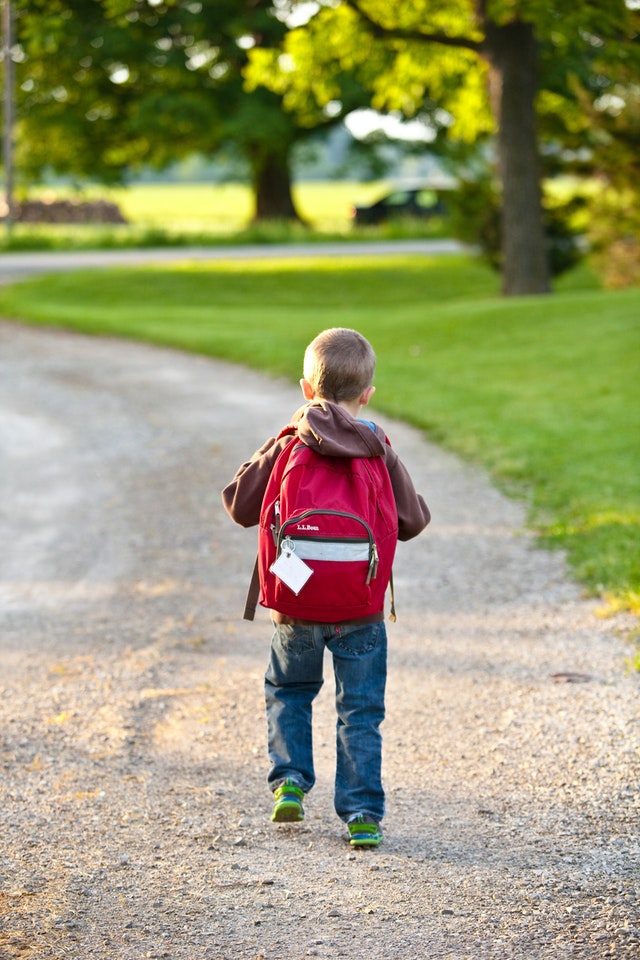
♦Â 255 walking trips are made per person, per year on average.
♦Â On average, 206 miles are travelled by walking per person, per year.
♦ Each walking trip is on average 17 minutes long.
♦ Women make more walking trips than men, they average 269 annually, whereas men average 240.
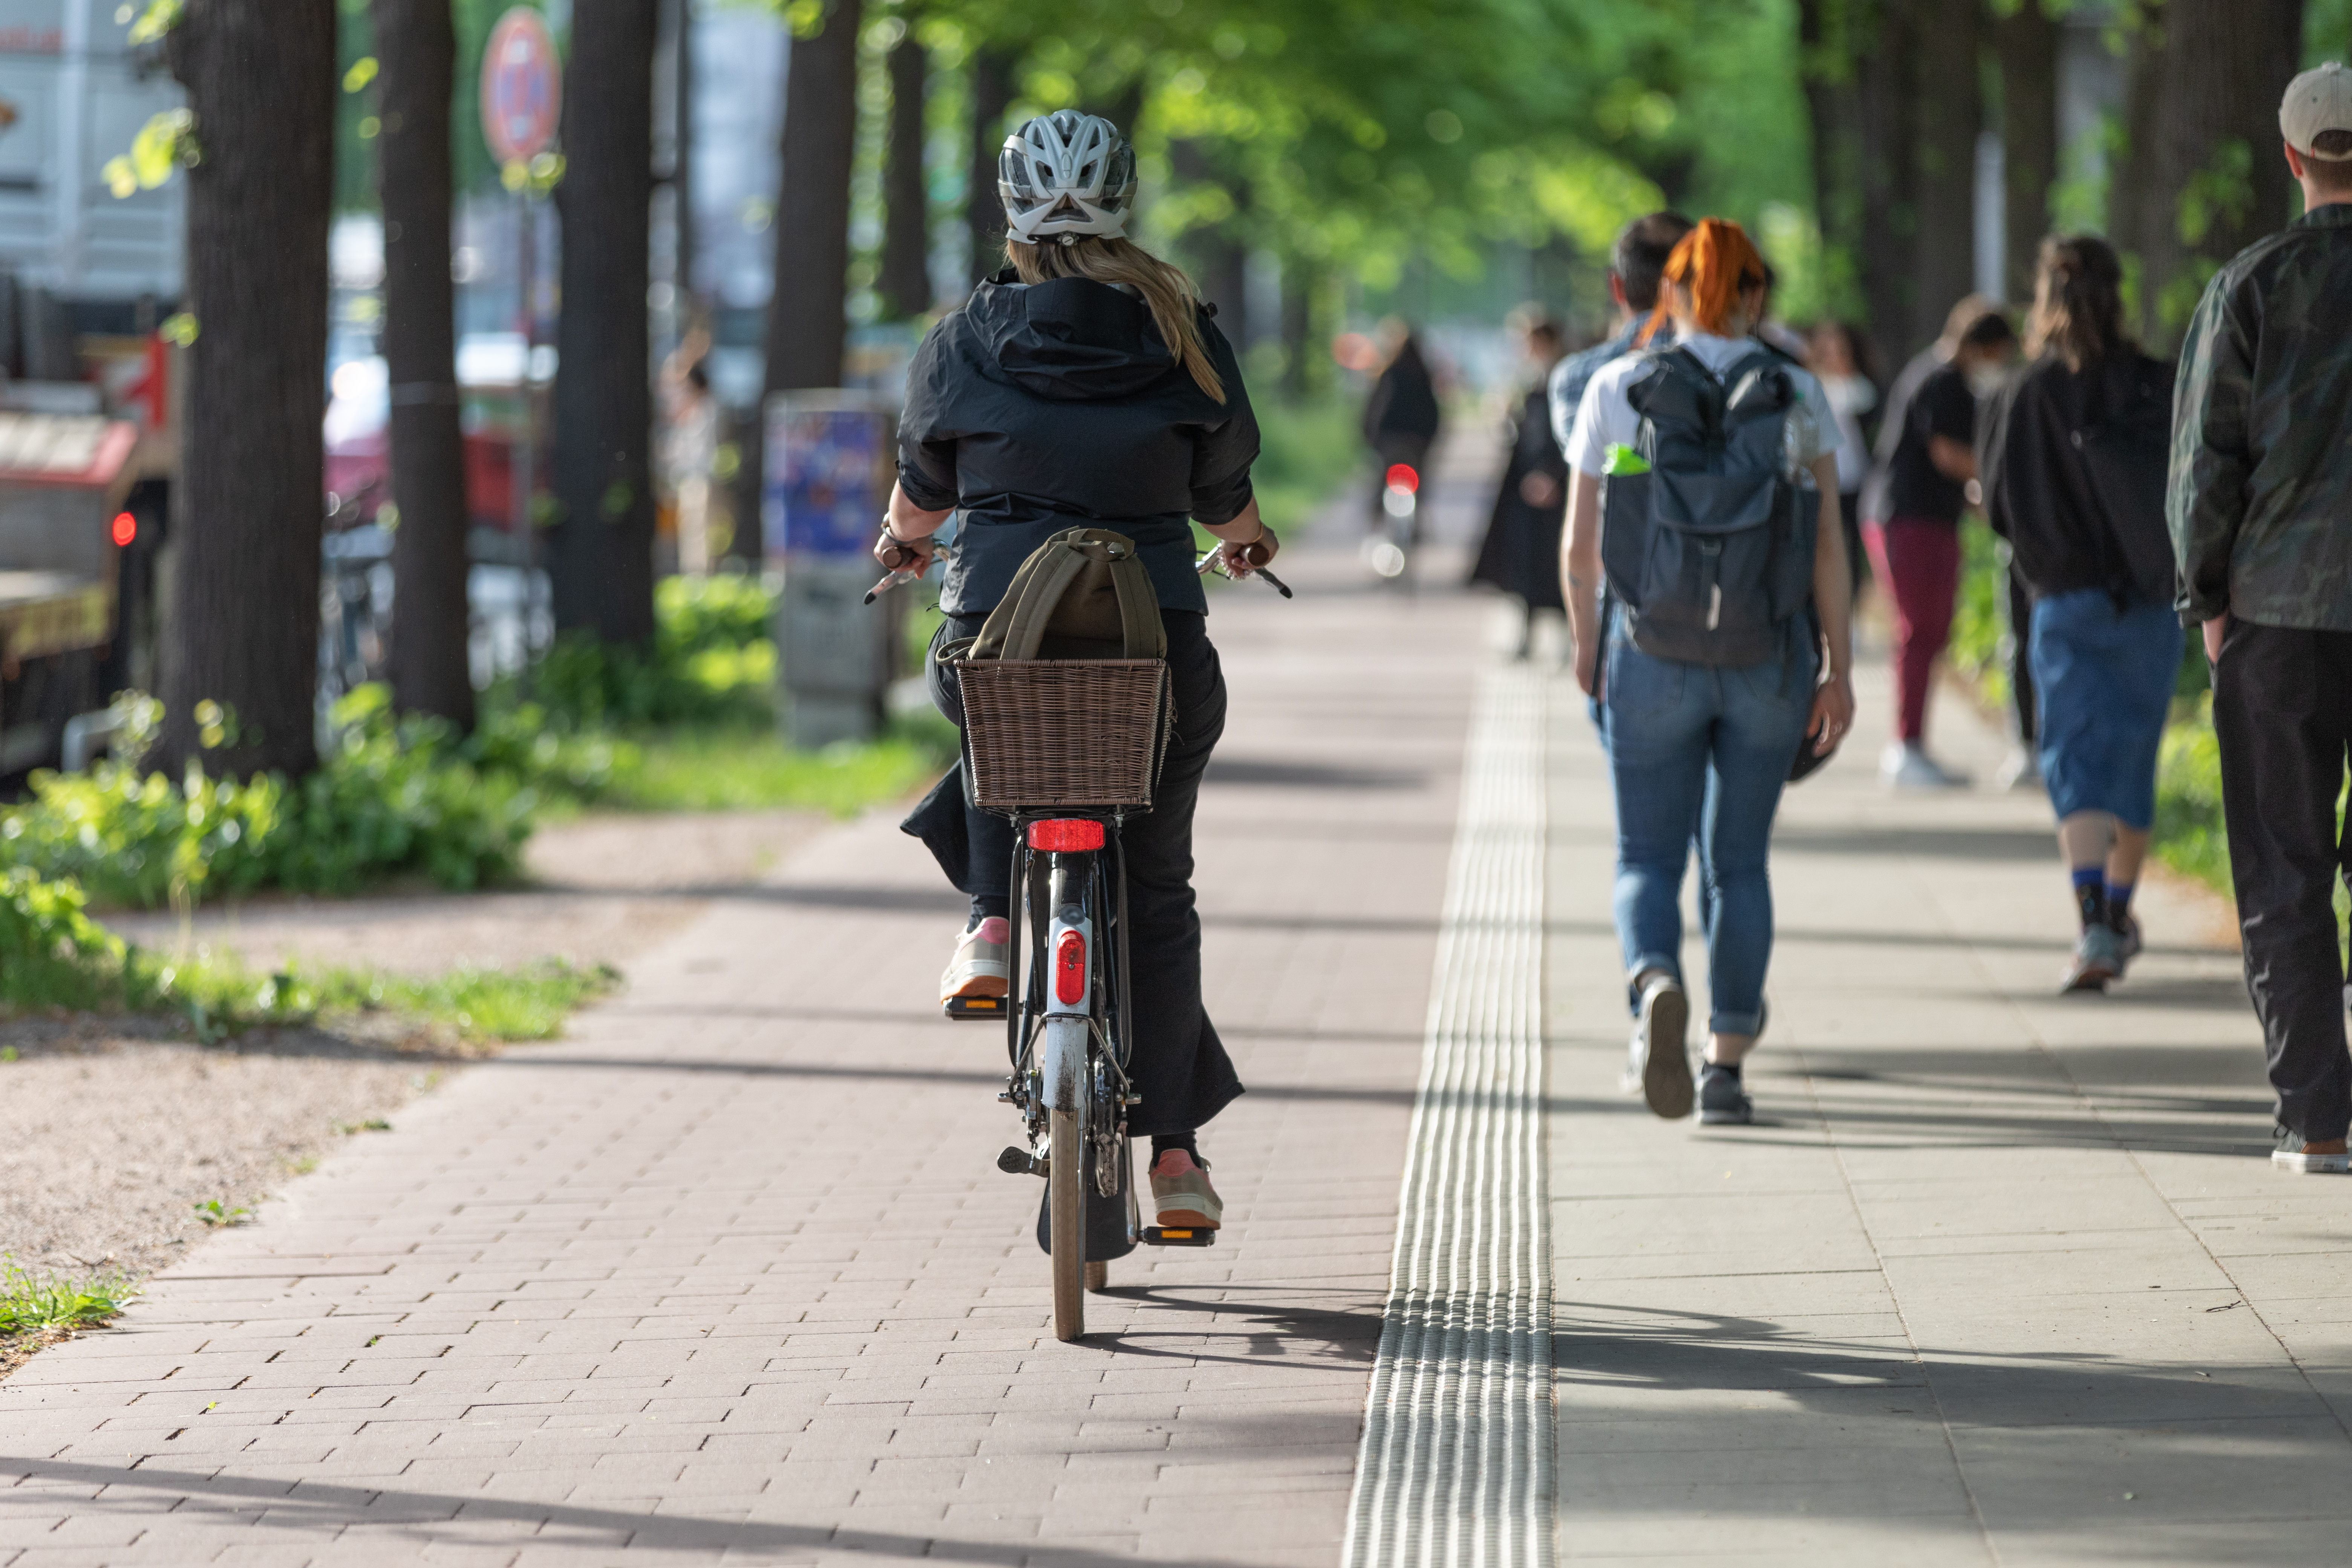
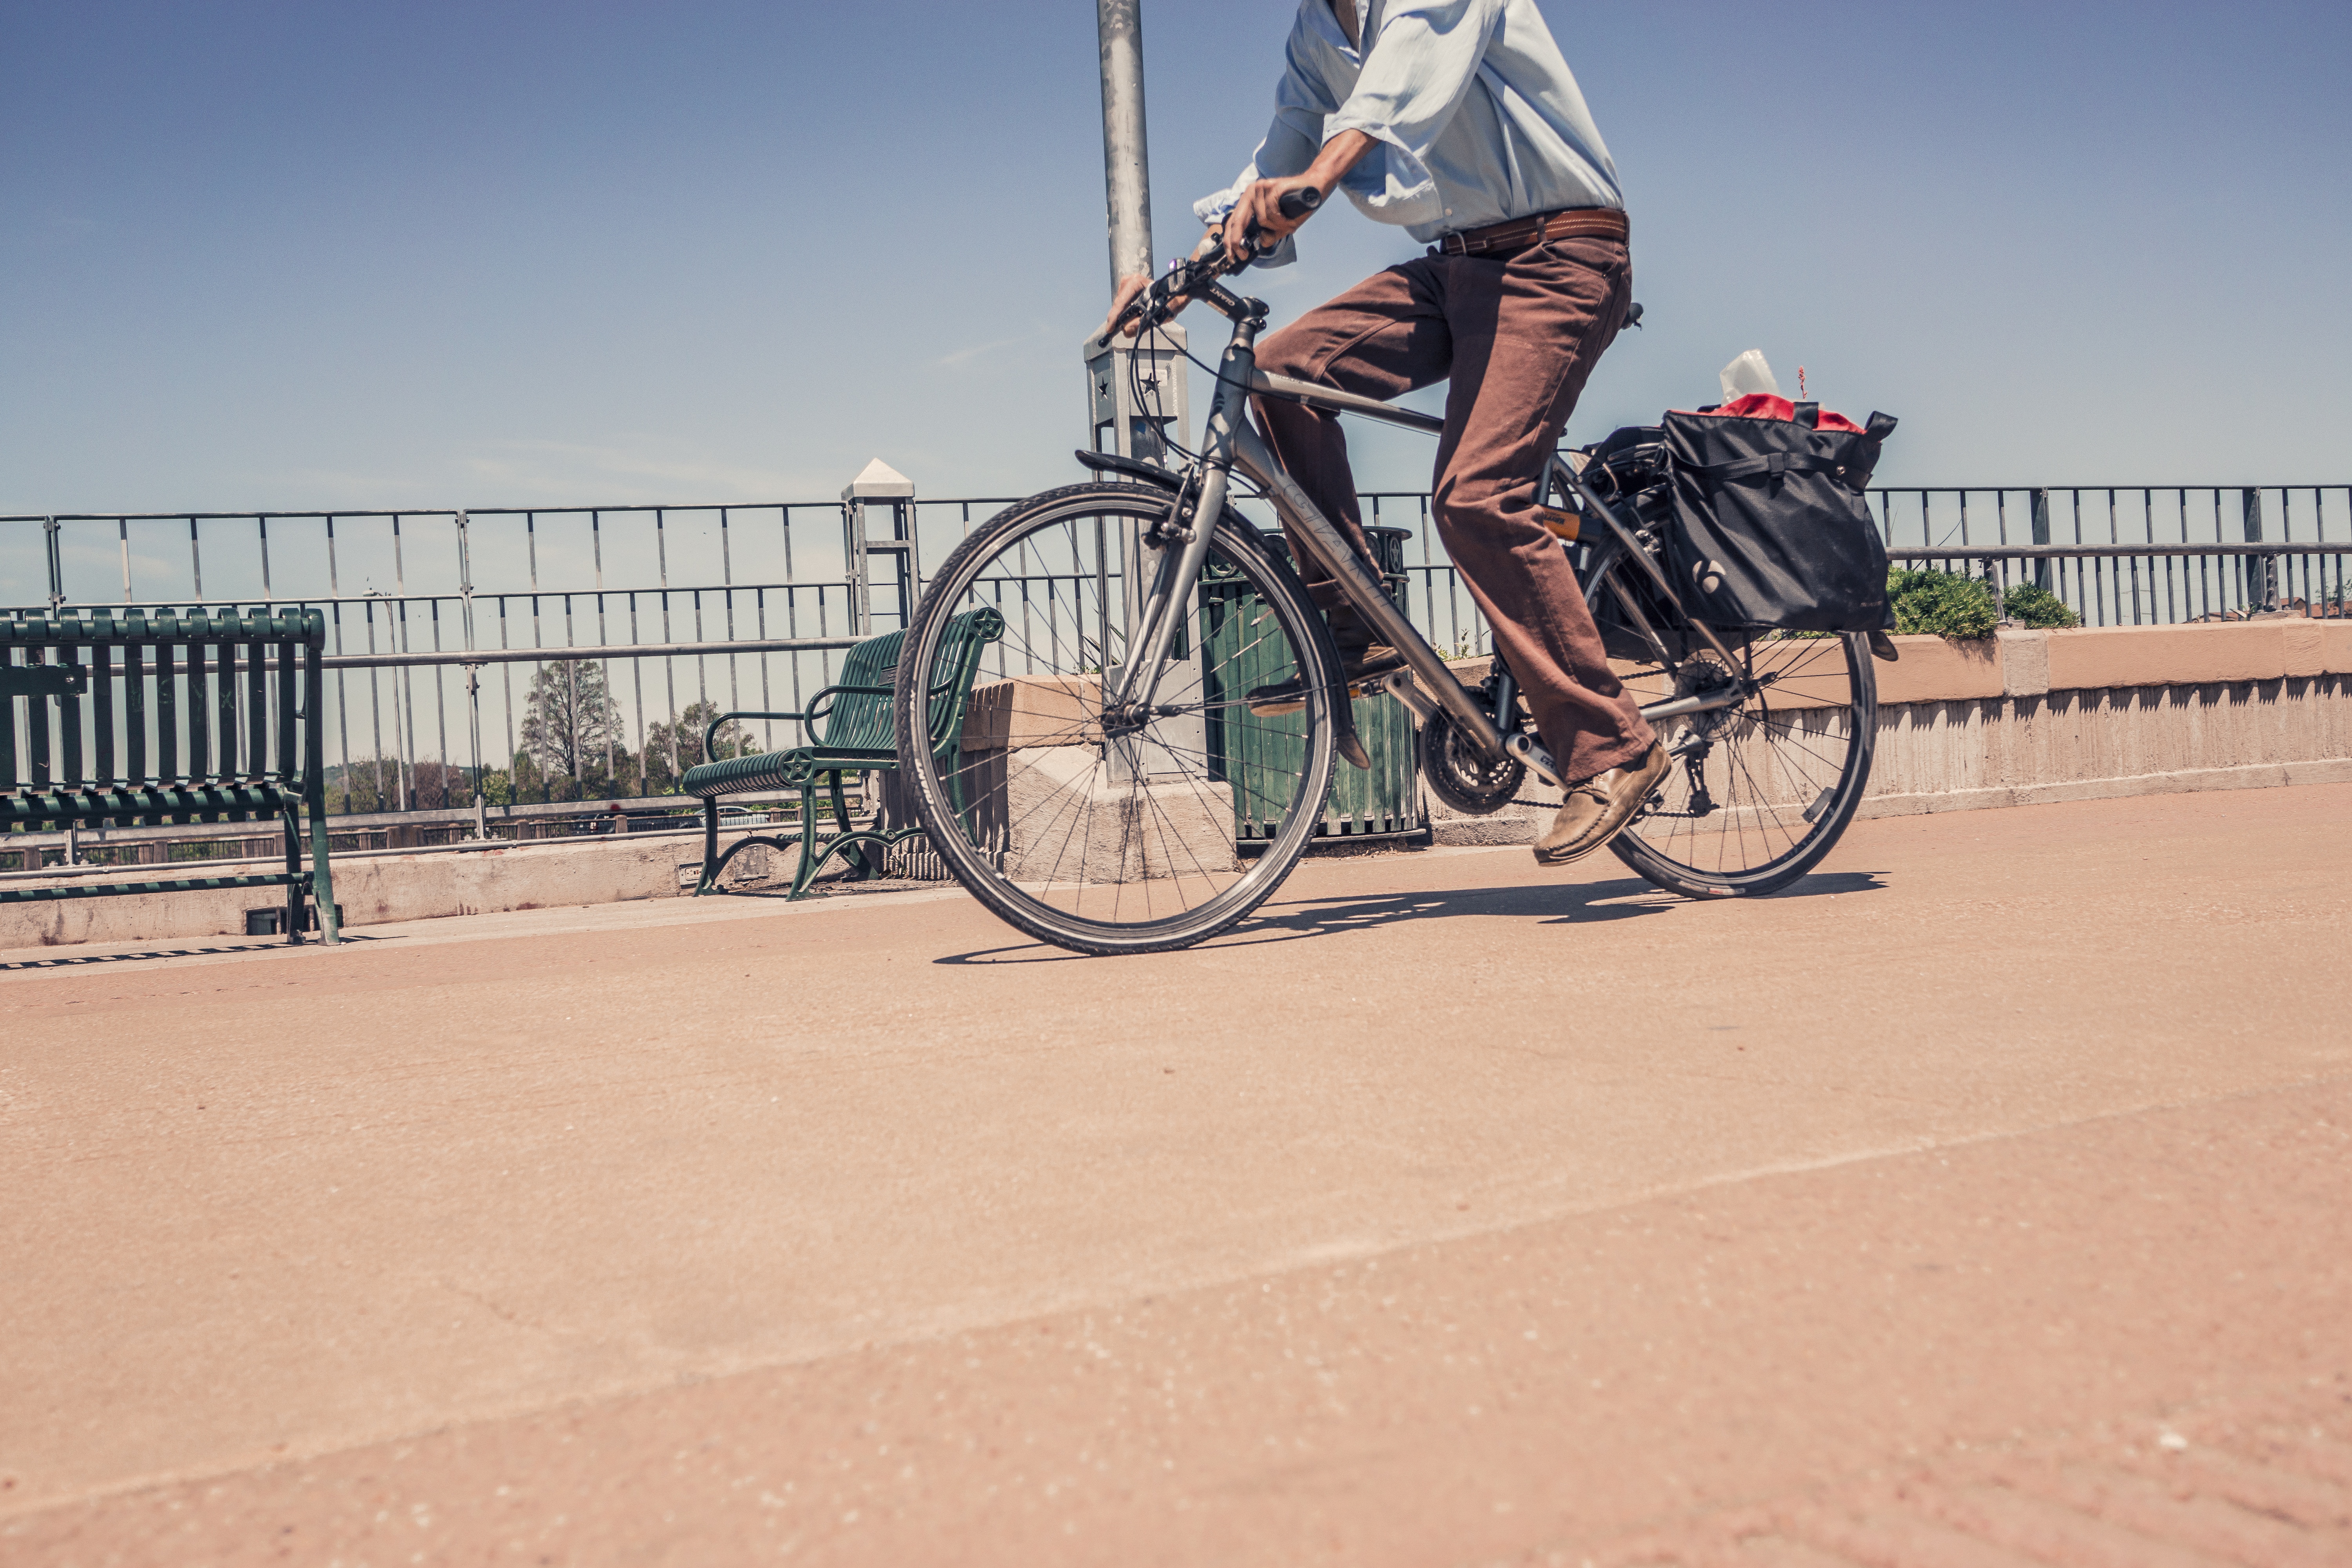
♦ There were 17 cycling trips per person, per year on average in 2017.
♦ 60 miles were travelled cycling, per person, per year on average.
♦ Cycling only makes up for 2% of journeys.
♦ Men make far more cycling trips, 24 on average, compared to just 9 for women.
♦ 36% of cycling trips are made purely for leisure purposes.
♦ 34% of cycling journeys are for commuting purposes.
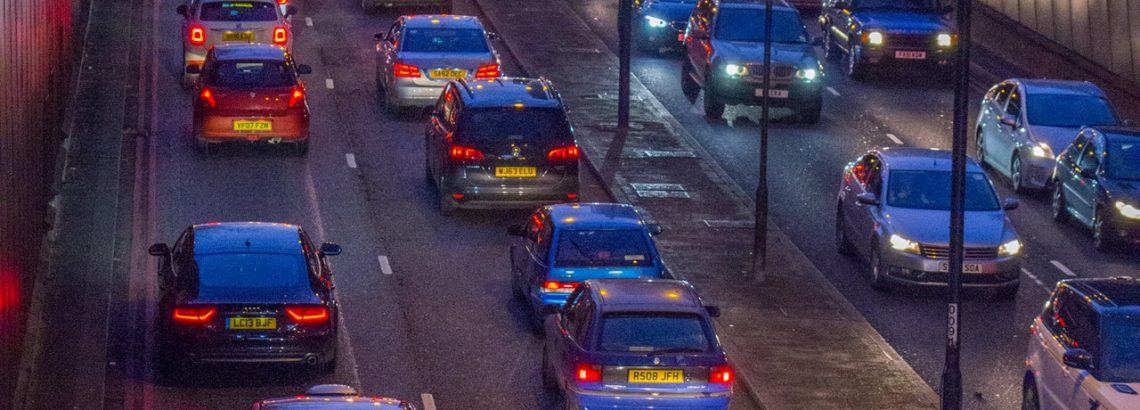
♦ On average, 594 trips are made by car, per person, per year.
♦ The average person travels 5,104 miles per year in a car.
♦ 61% of trips are made by car.
♦ Women make on average 613 trips and men 575 by car.
♦ Men and women that fall into the 50-59 age category travel the most amount of miles per year.
♦ There are 32.4 million licence holders in the UK.
♦ 56 bus trips are made per person, per year on average.
♦ 315 miles are travelled by bus, per year, on average.
♦ In total, 6% of trips are made by bus.
♦ 24% of bus journeys are for shopping purposes and 22% for commuting purposes.
♦ 17-20-year-olds are the most frequent bus users, followed by the over 60’s.
♦ The average person makes 21 surface rail trips per year.
♦ The majority of rail trips are for commuting purposes (47%) and 25% are for leisure purposes.
♦ Only 2% of all trips are made by rail.
♦ Men use rail more frequently with 24 trips per year, compared to 18 trips for women.
You can view the full report and results here.
The next National Travel Survey will be published July 2019 but you can take a look at last years results here.


Get the latest updates regarding our services.


Smarter Travel Limited.
Registration No. 09513648.
England, 847 The Crescent, Colchester, CO4 9YQ.
VAT reg: 249134404.