Studying how, why, when and where people travel as well as factors affecting their travel choices. This travel survey questions 16,000 individuals from 7,000 households in Britain. This is the first release of results and a second, more detailed analysis is due to be published later in the year.
The main findings from the survey were that on average people made 954 trips per year and the distance travelled was 10% lower than in 2002. The majority of trips were made by car (either as a passenger or the driver) with walking being the second most common mode of transport. It was found that woman travel more often than men, making 981 trips on average and men making 927 trips, however, men travel greater distances.
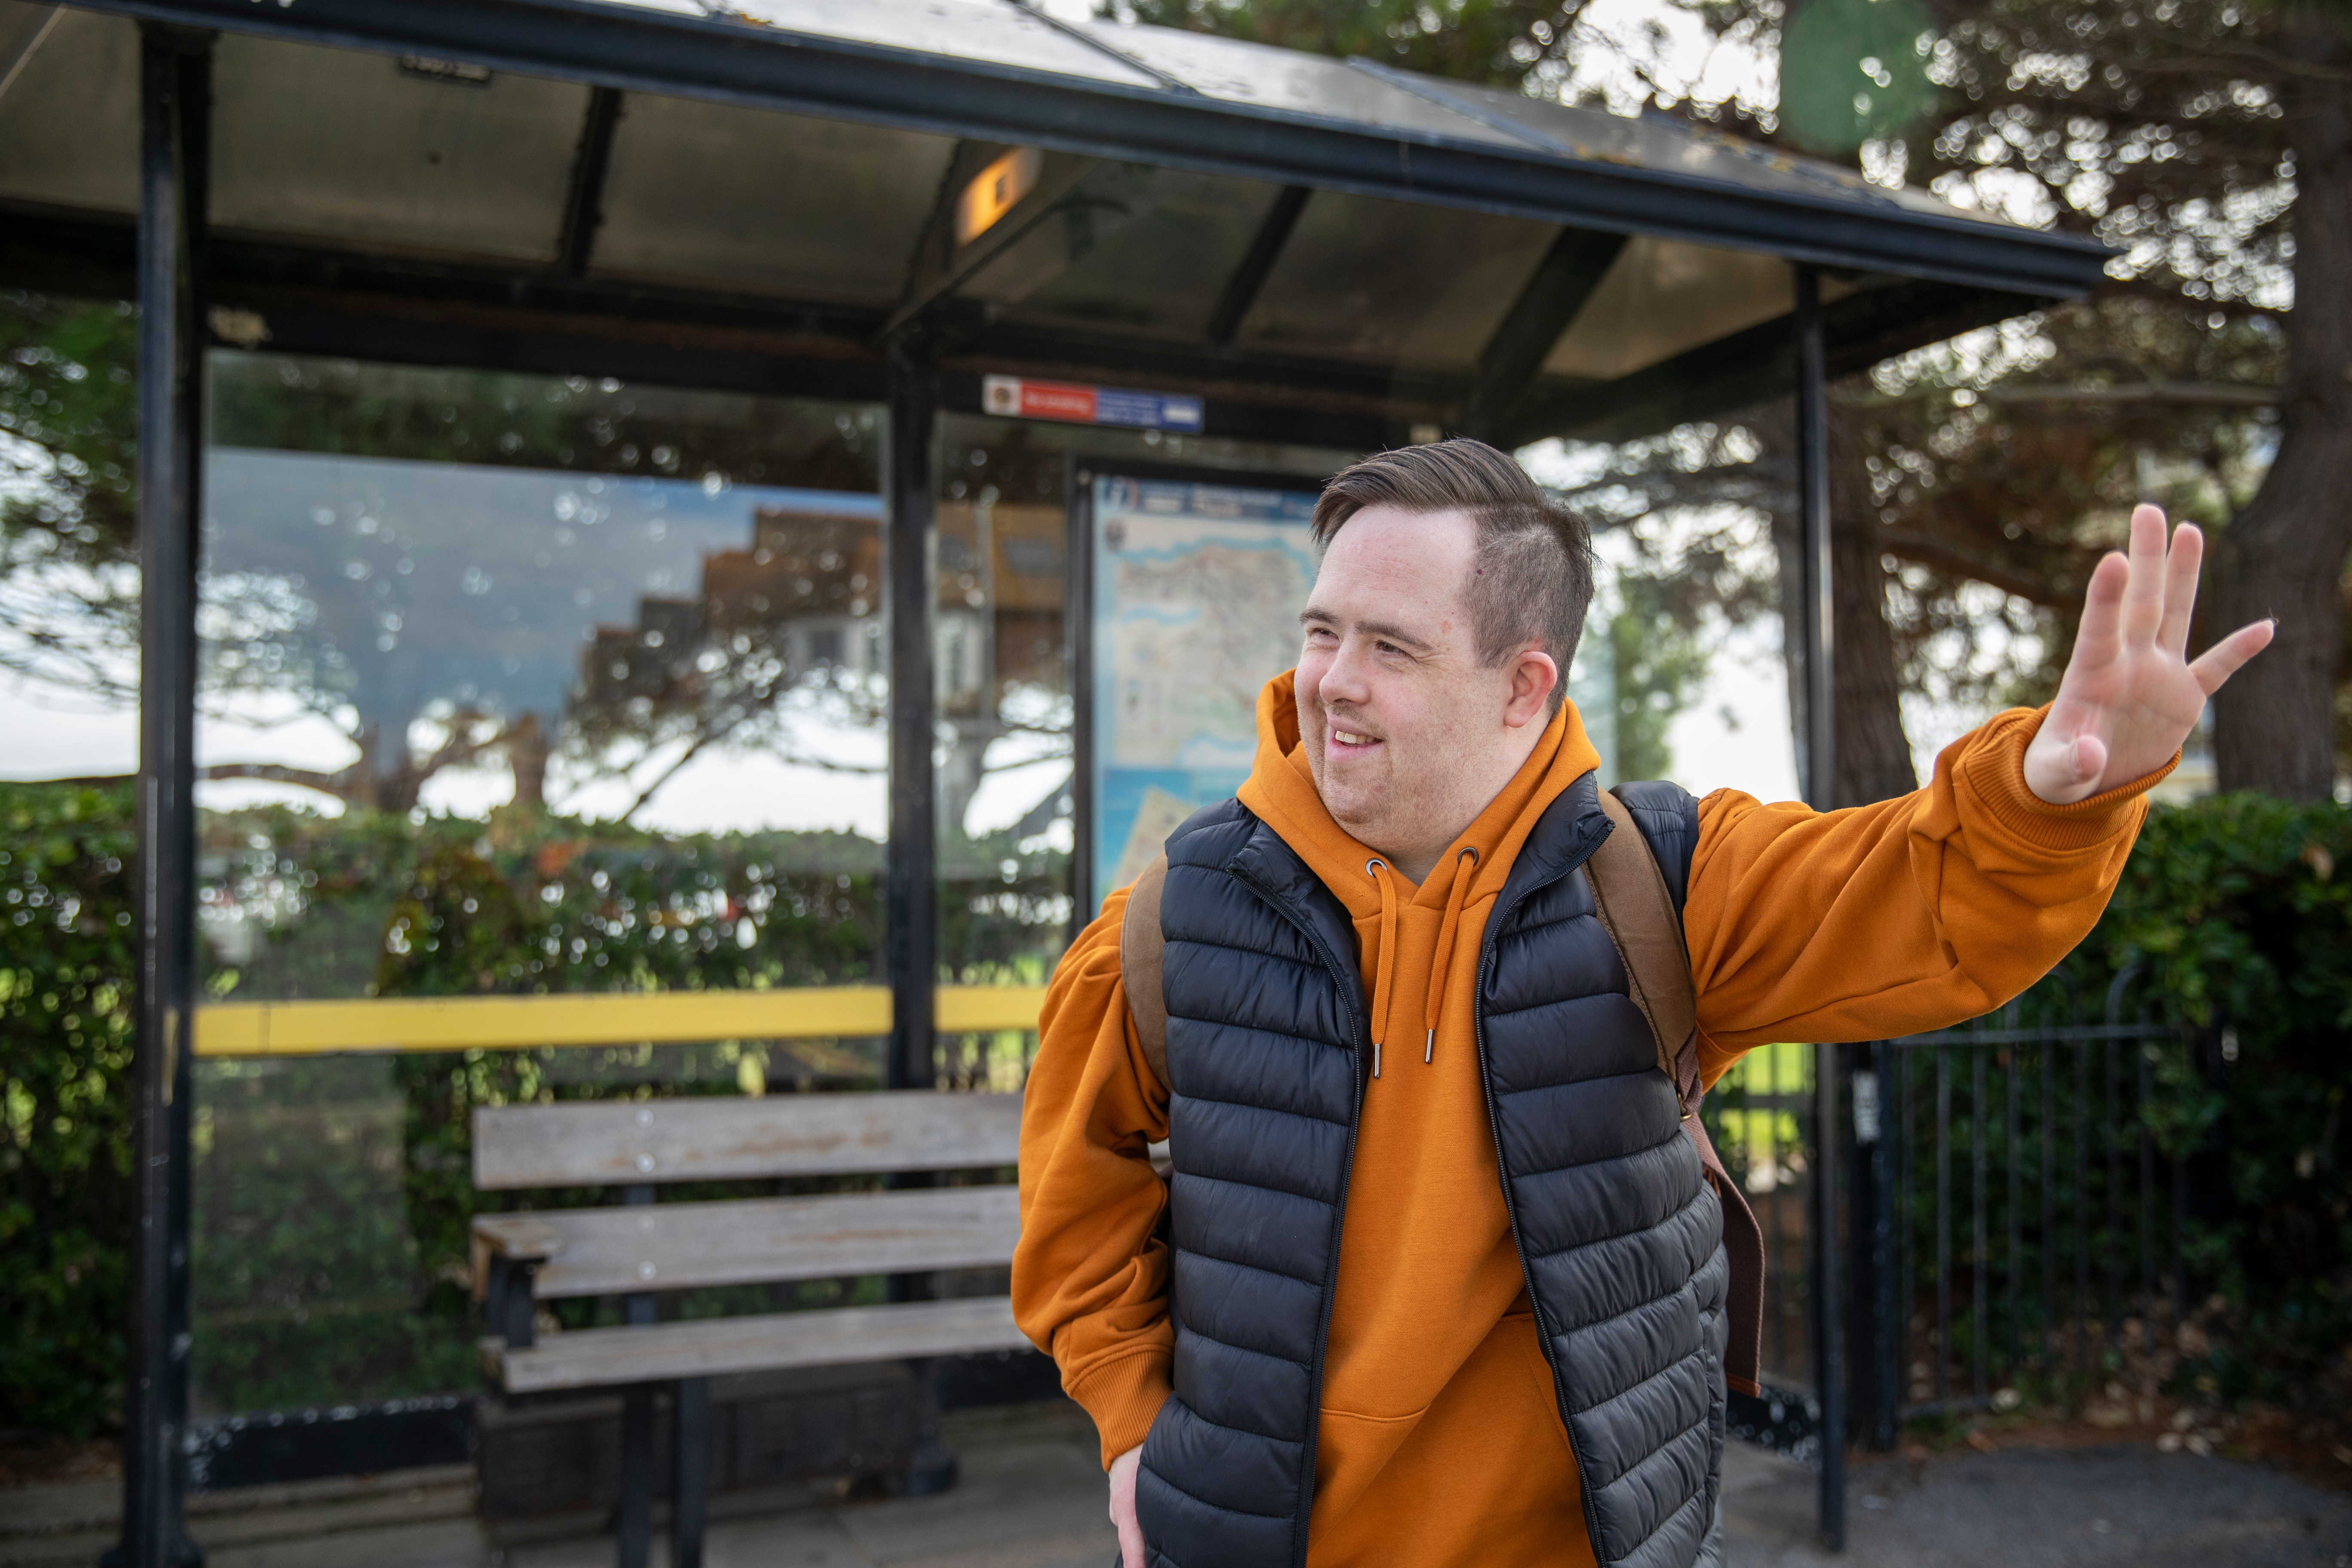
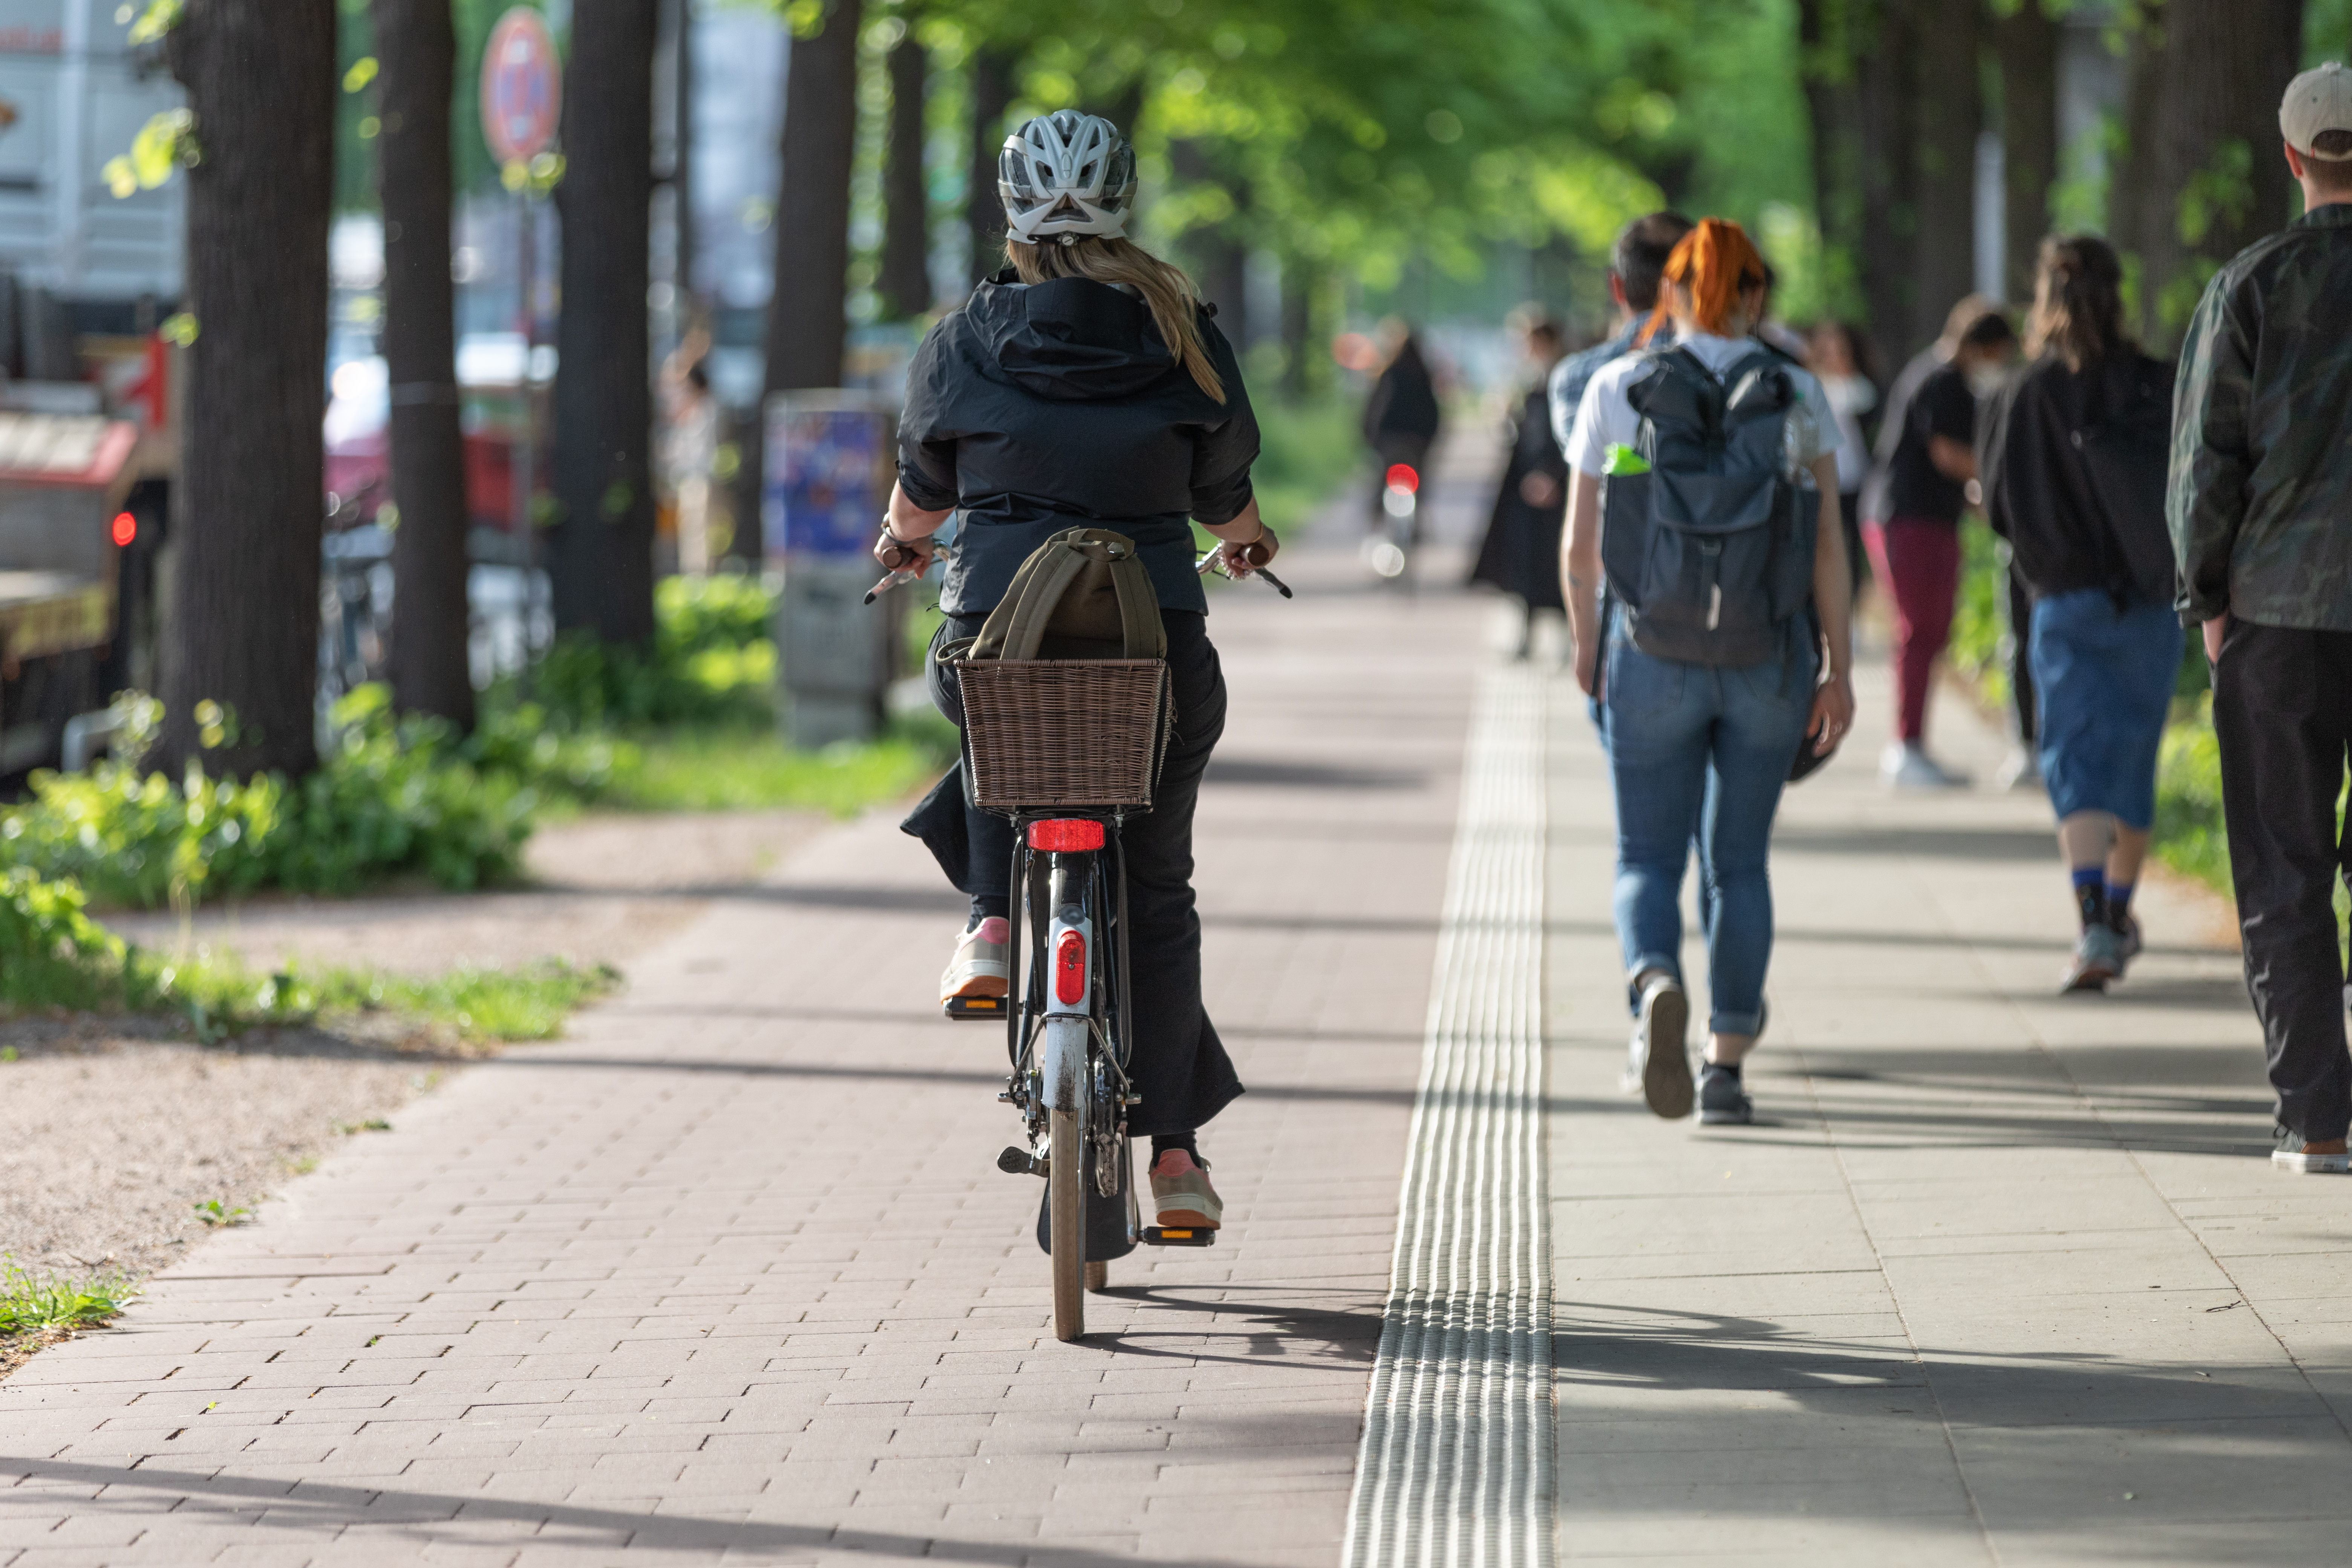
• 80% of trips for distances less than one mile were walked.
• 243 walking trips were made on average per person, per year.
• 198 miles was the average distance walked, per person, per year.
• 16 minutes was the average walking journey time.
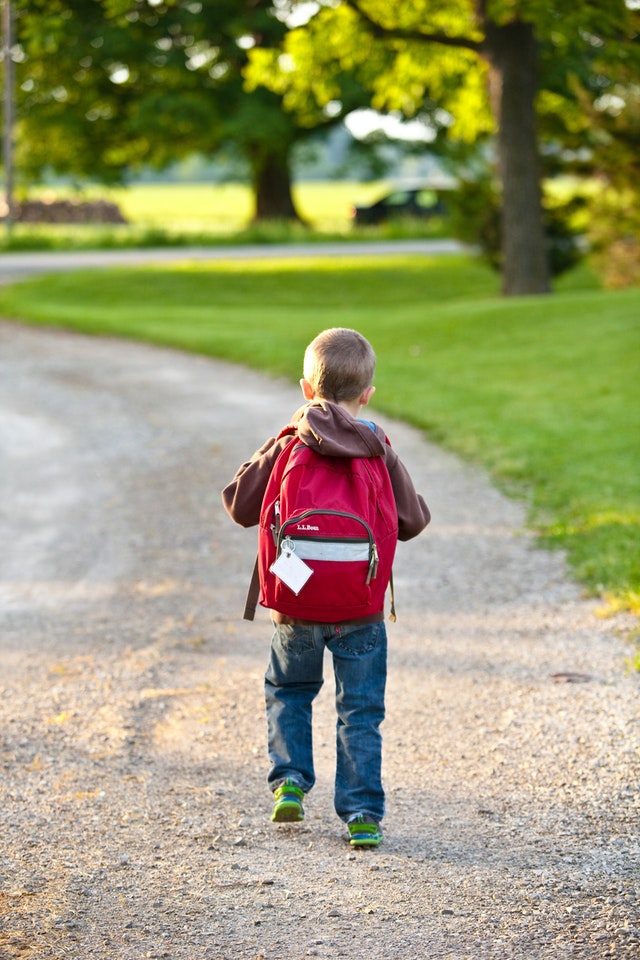
• 23% of walking trips were just for simply going for a walk, whereas, 21% were to walk to a place of education, 19% for shopping and 17% for leisure establishments.
• 11% of people commute by walking.
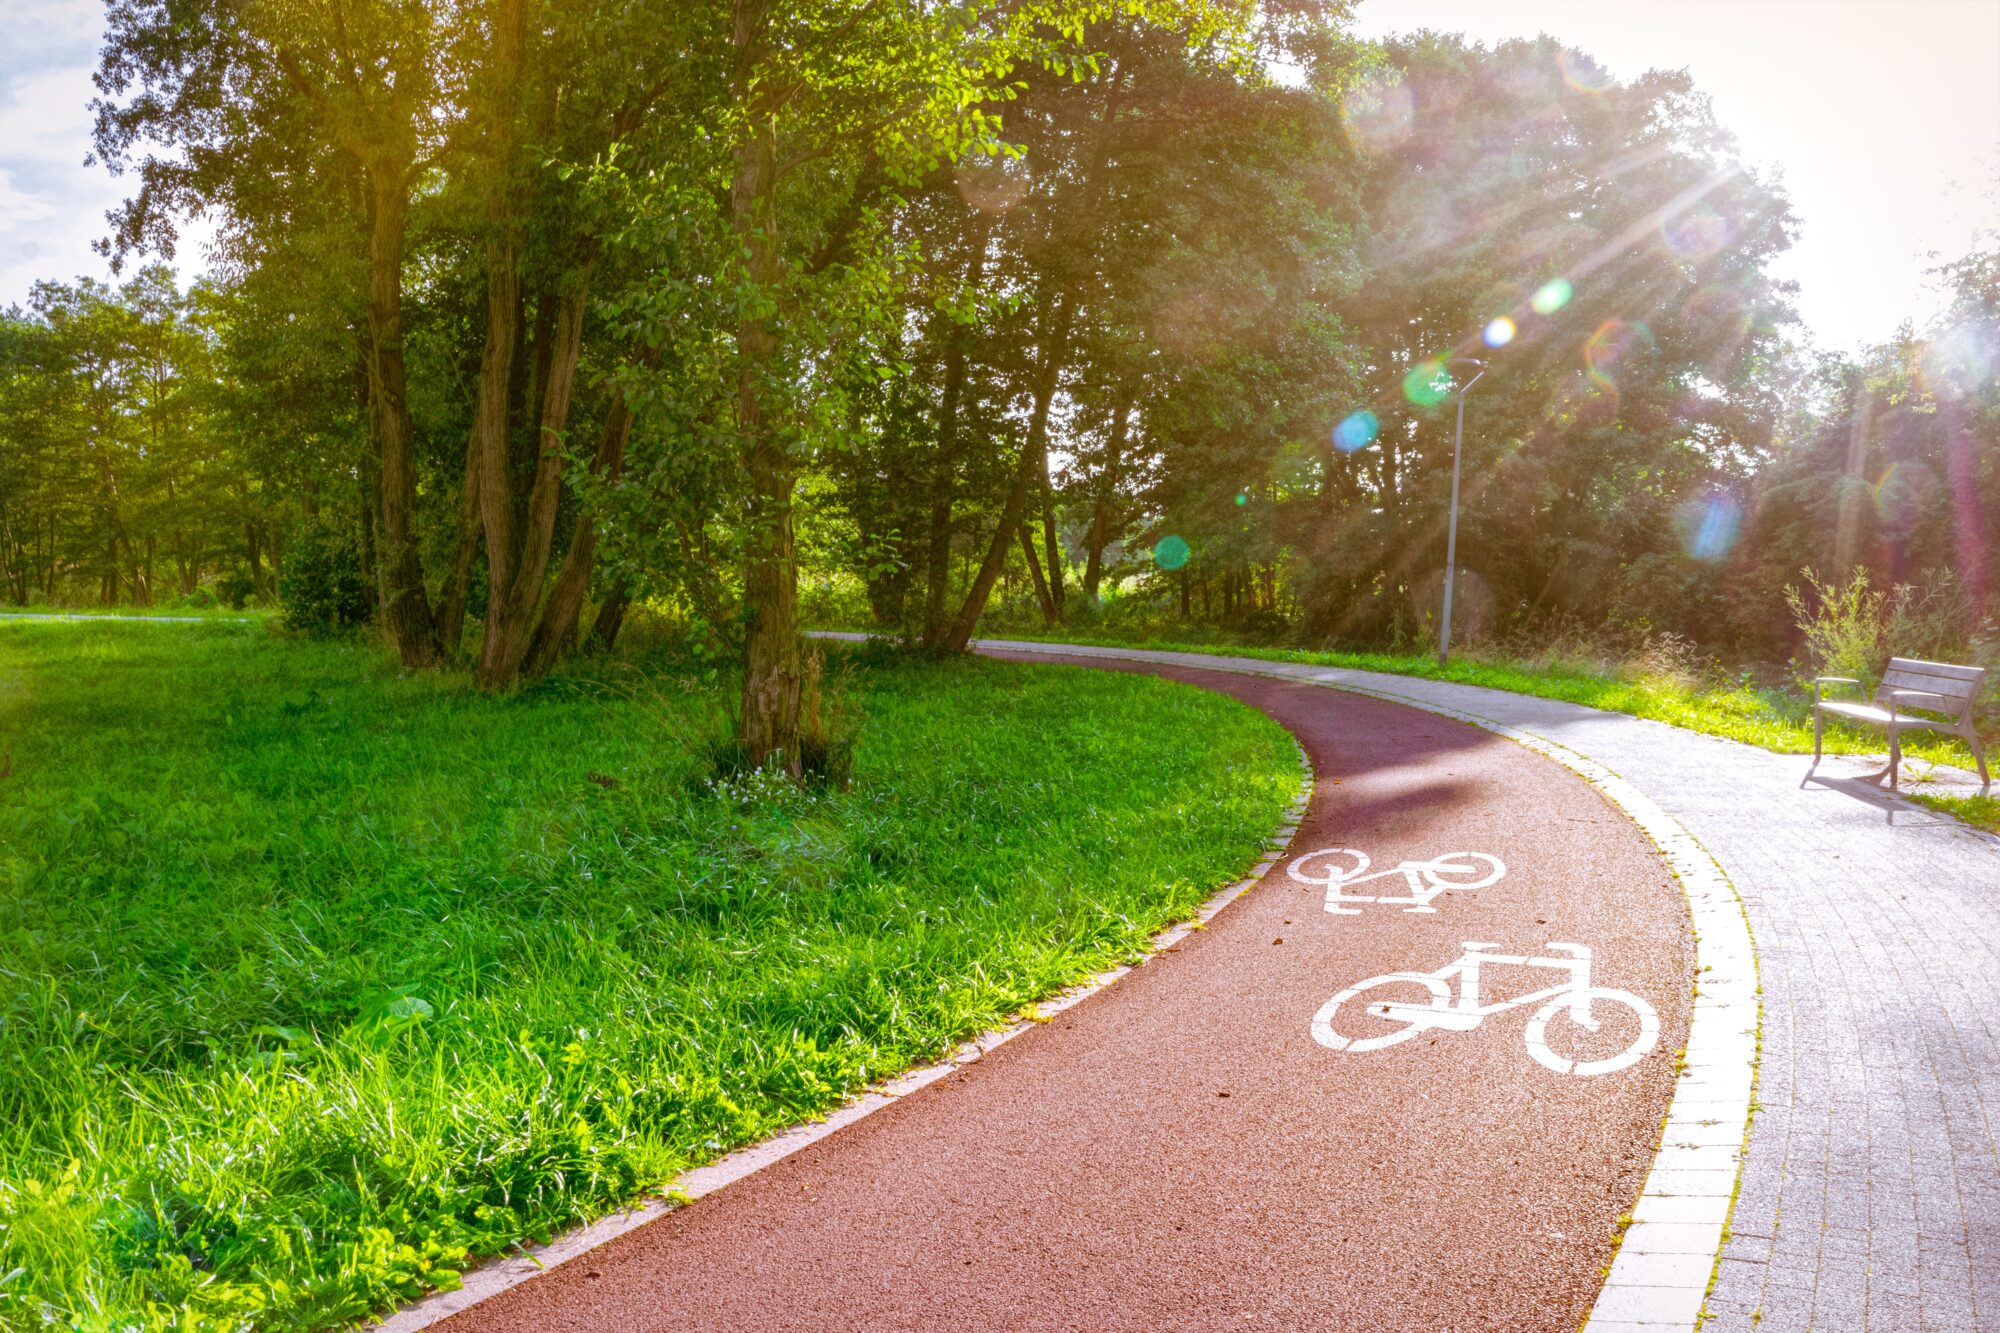
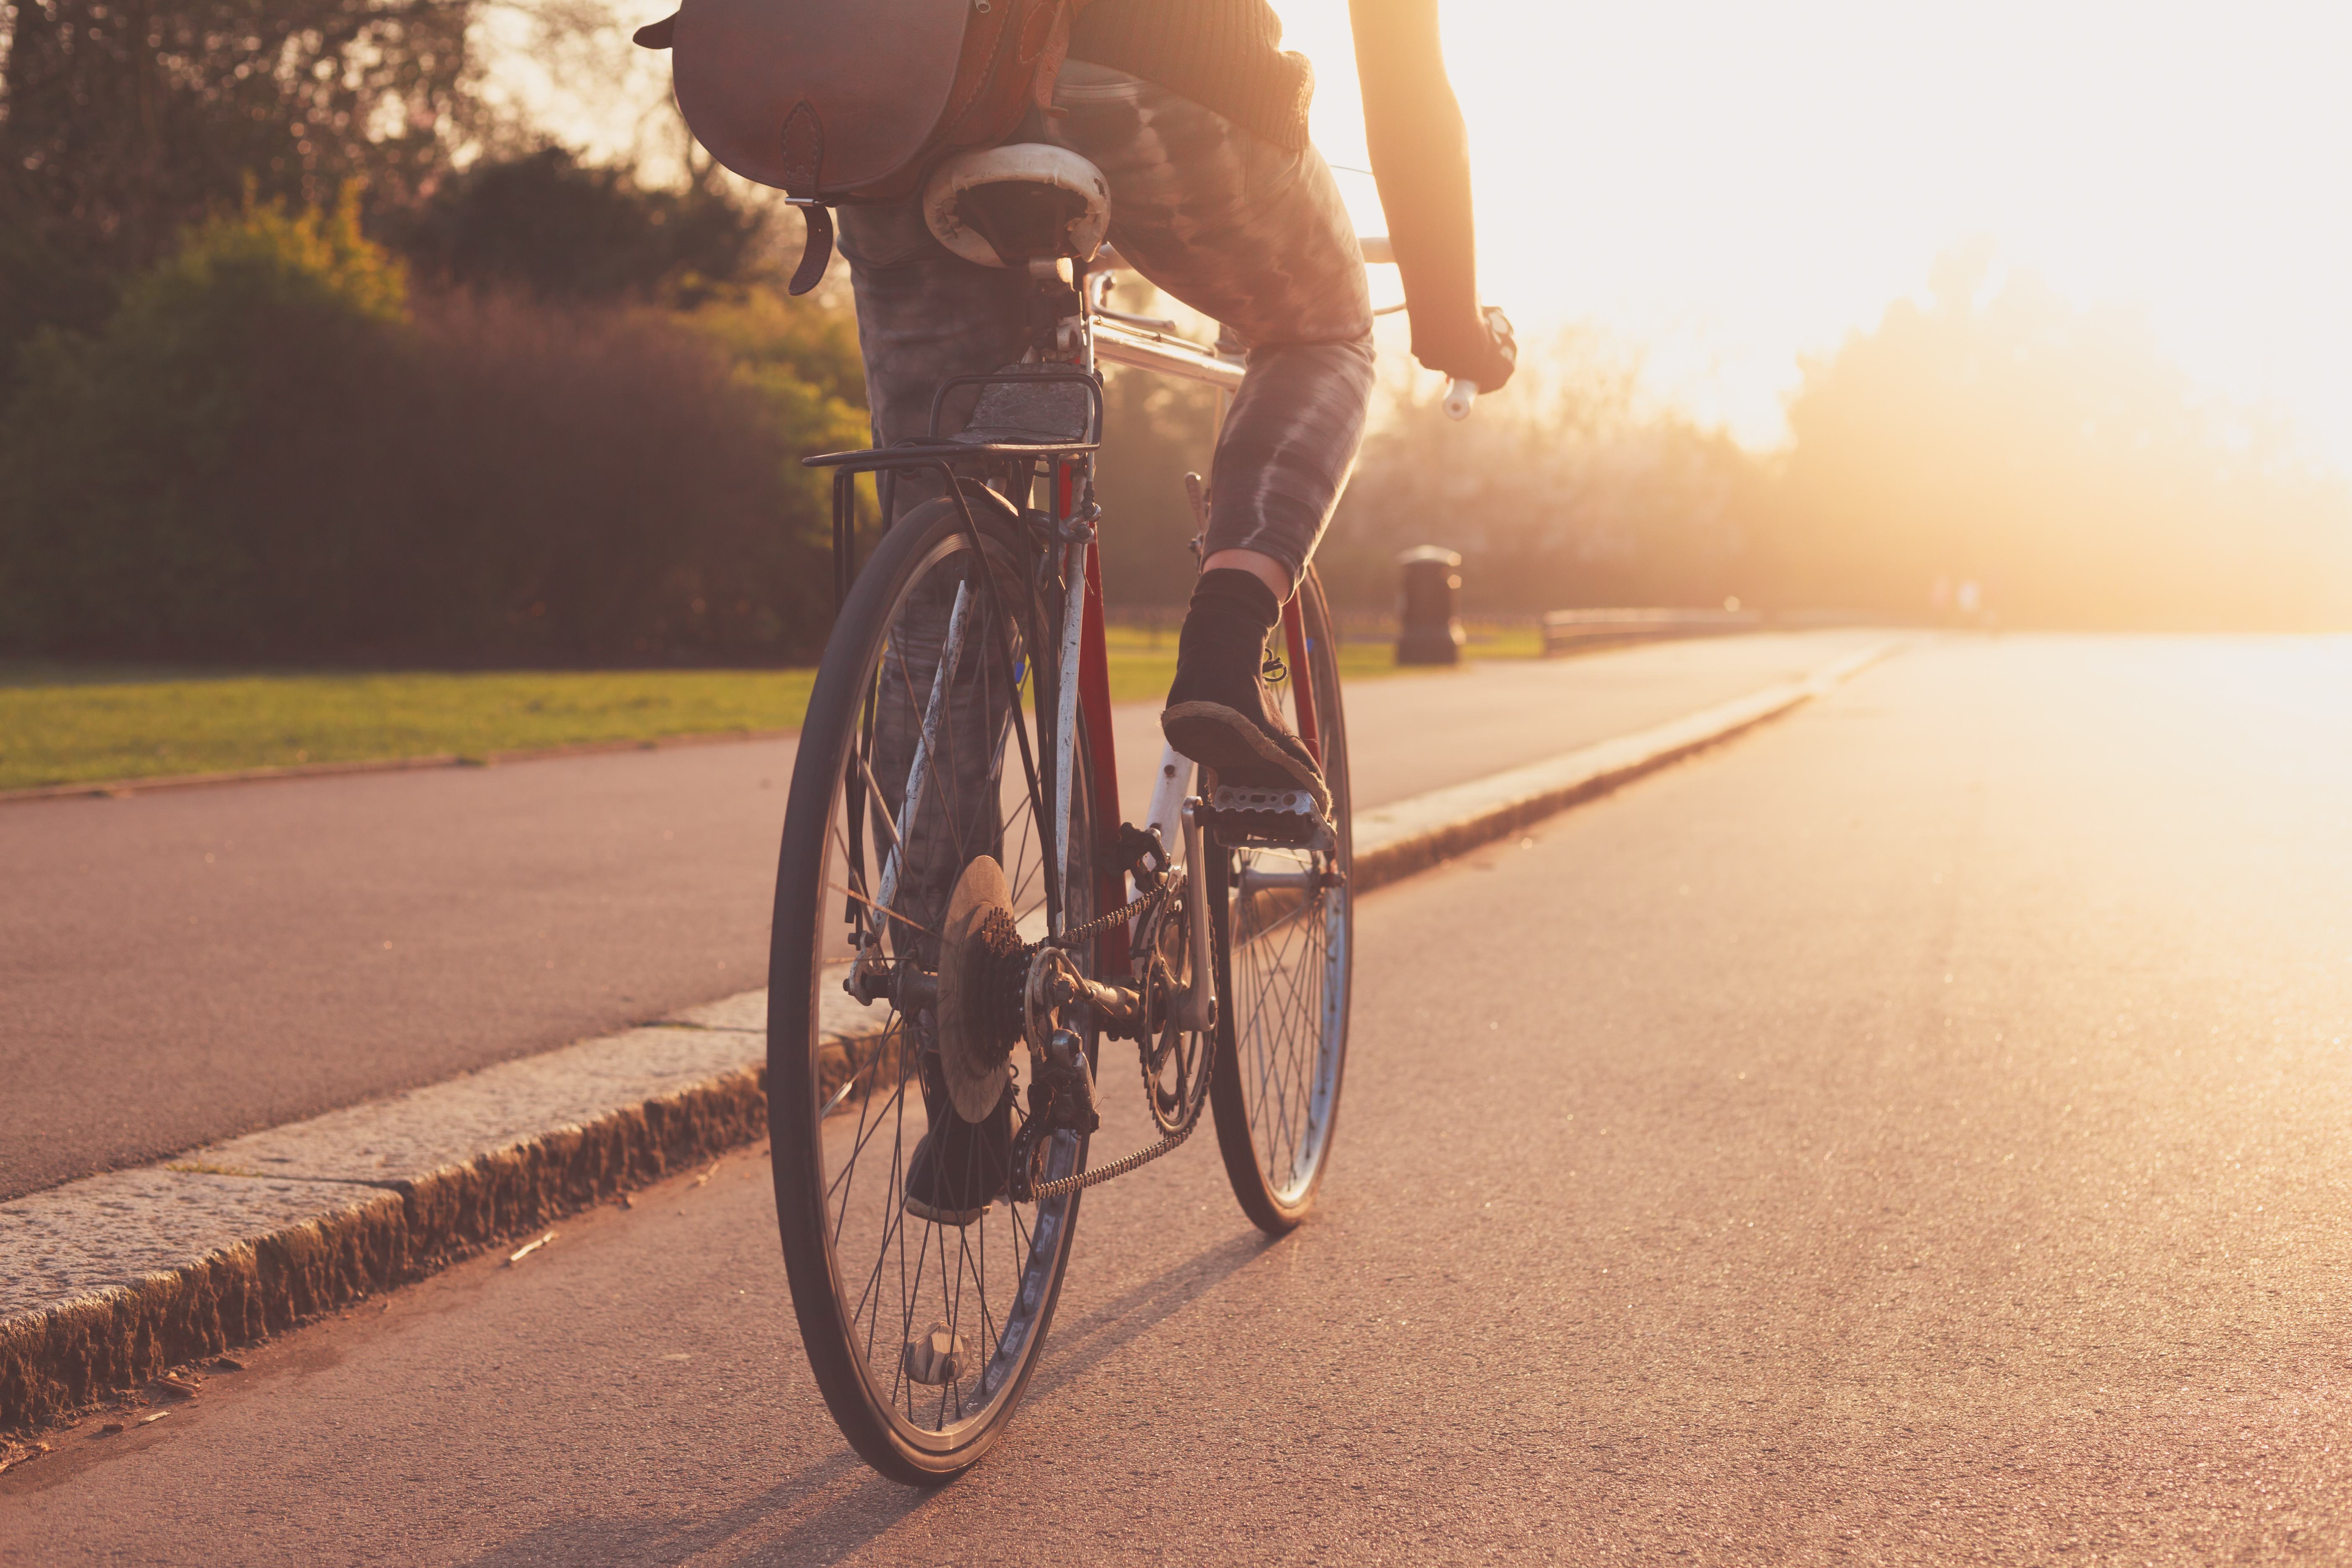
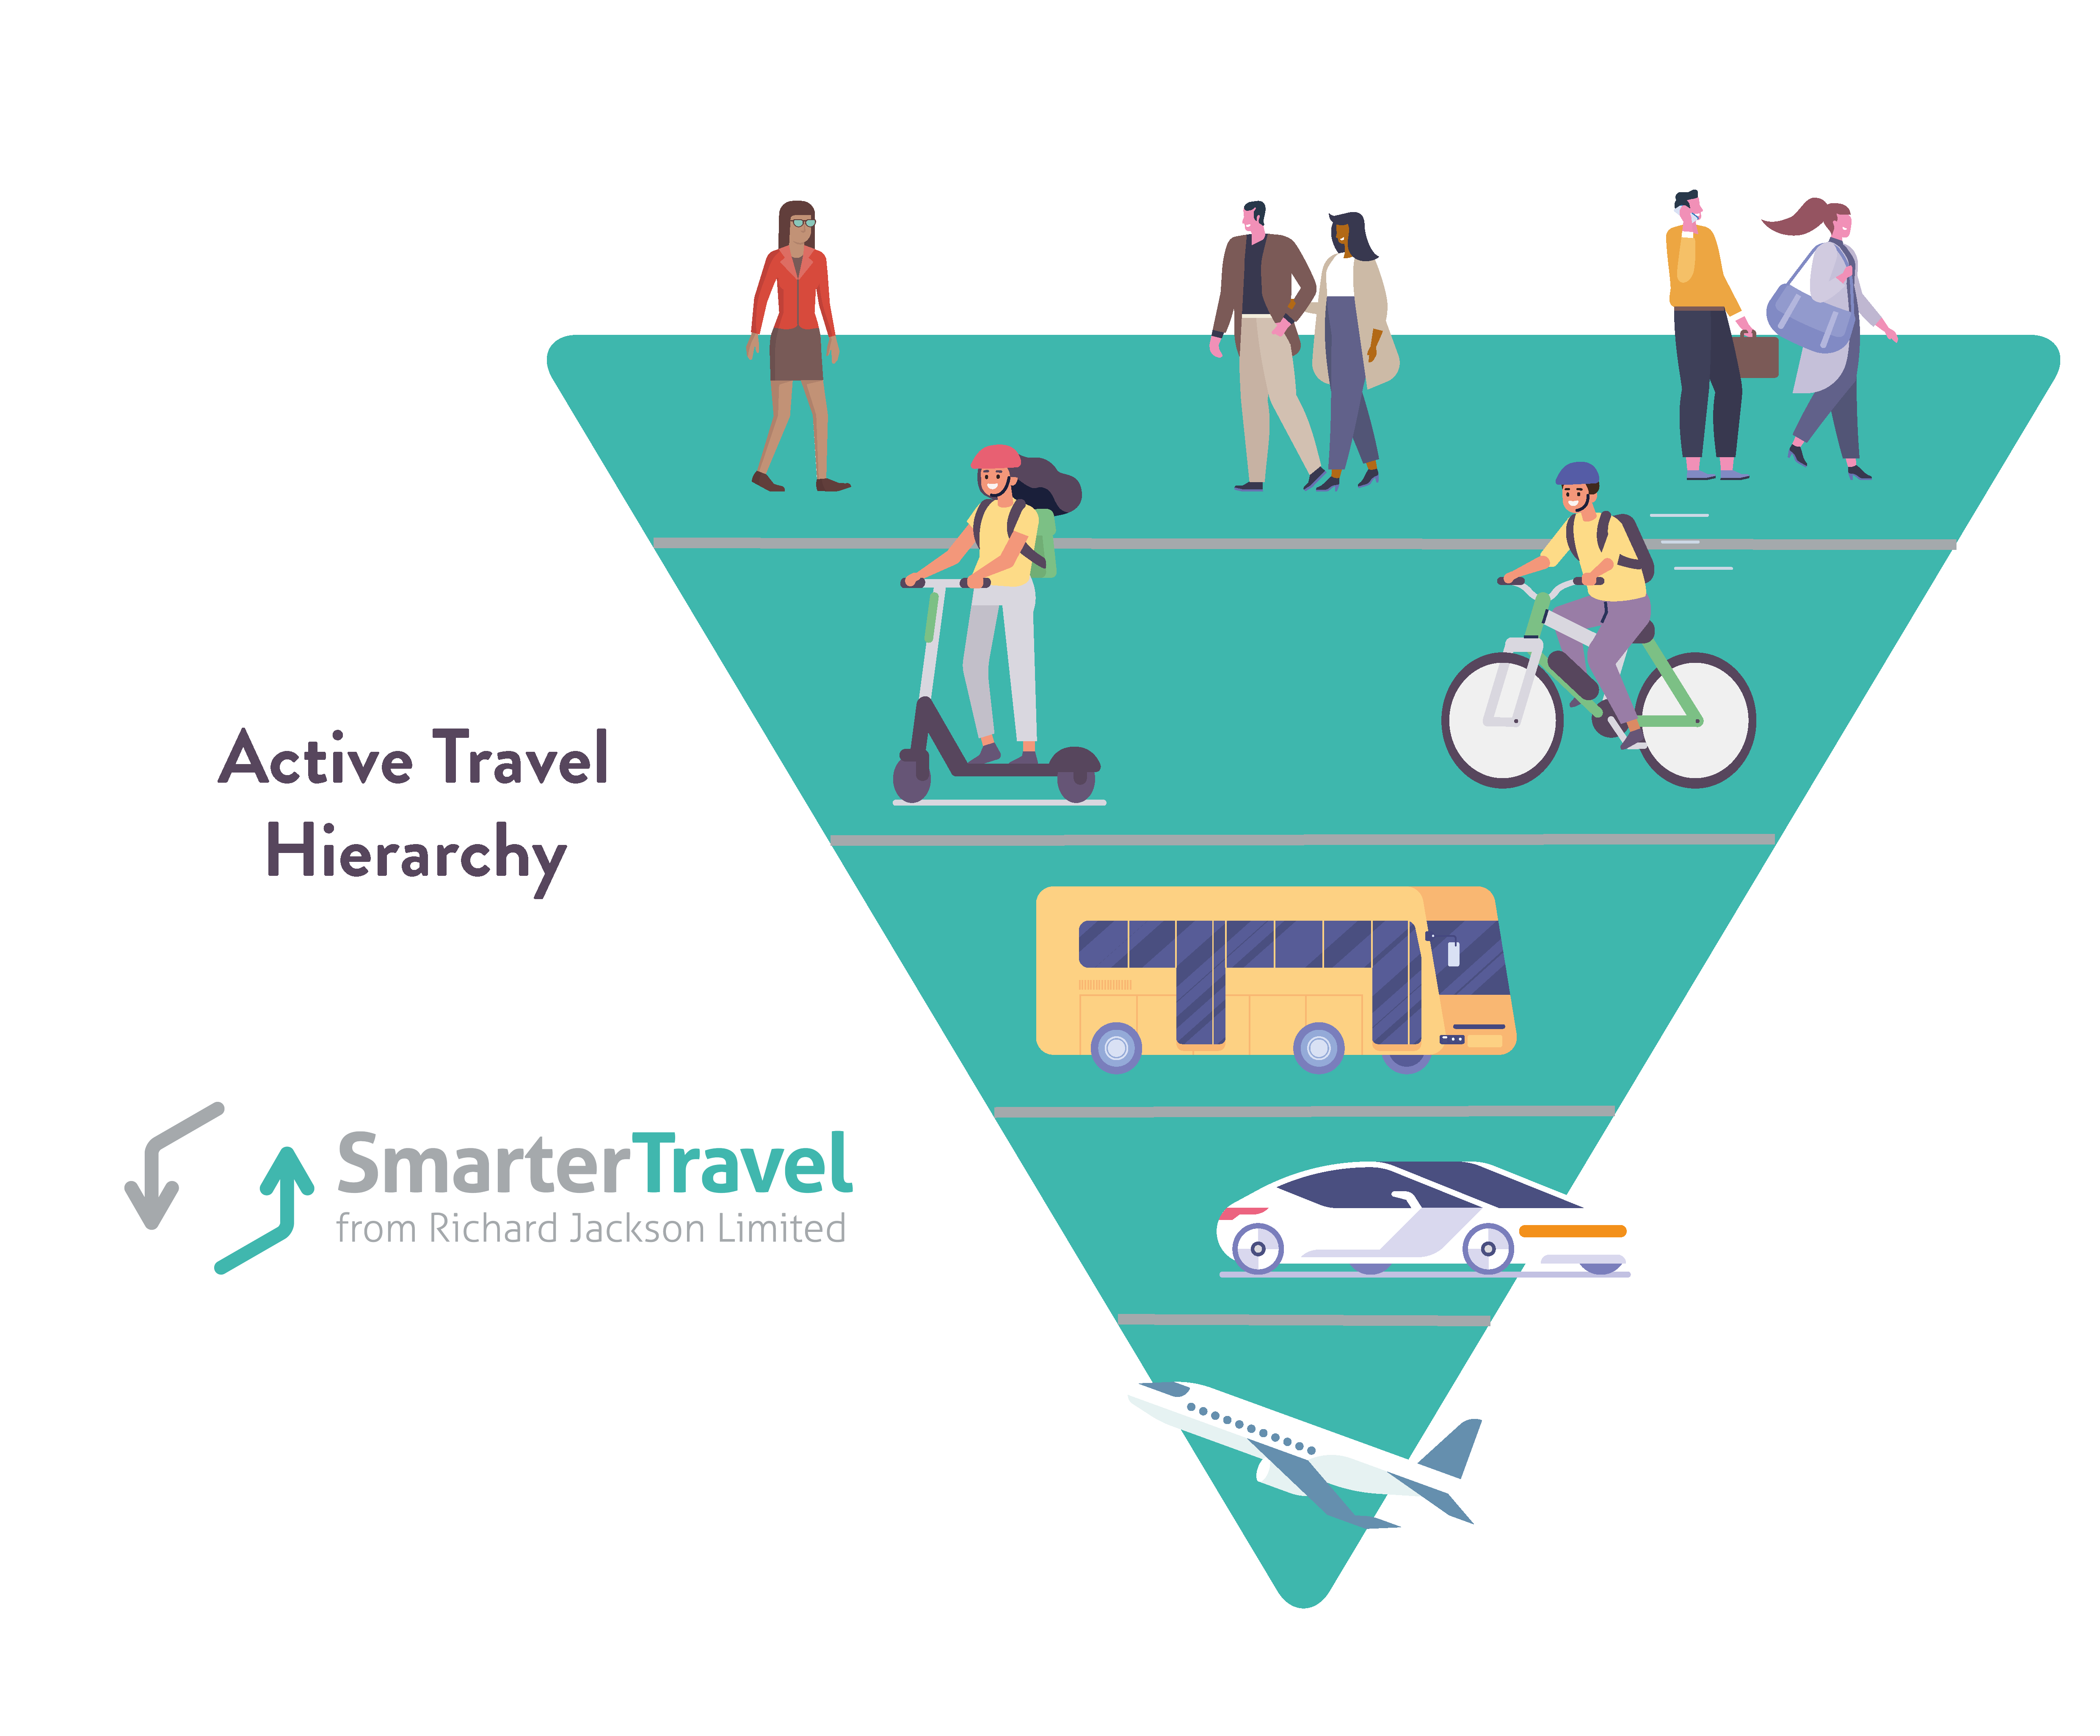
• 15 cycling trips are made per person, per year on average.
• Per year, people travel 53 miles on a bike on average.
• The most popular age for cycling is between 40-49, this is for both men and women.
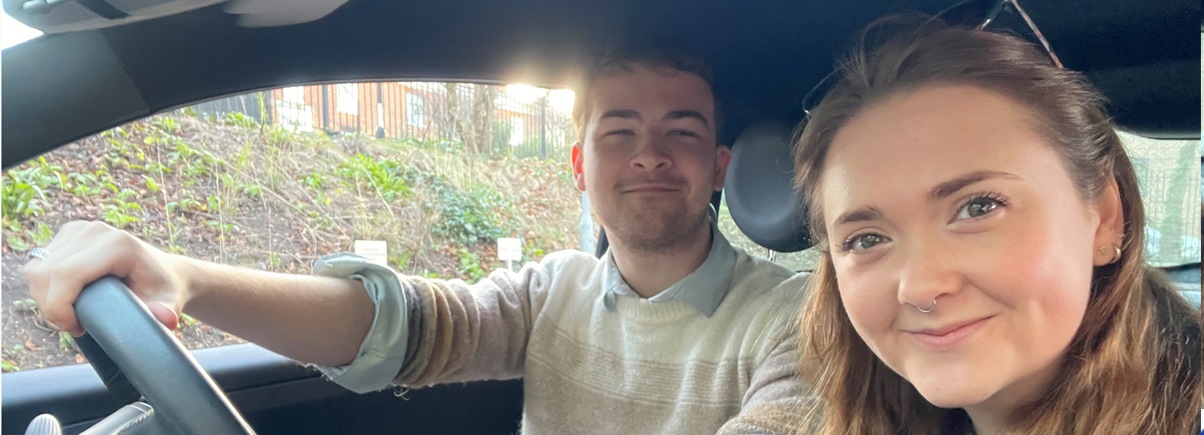
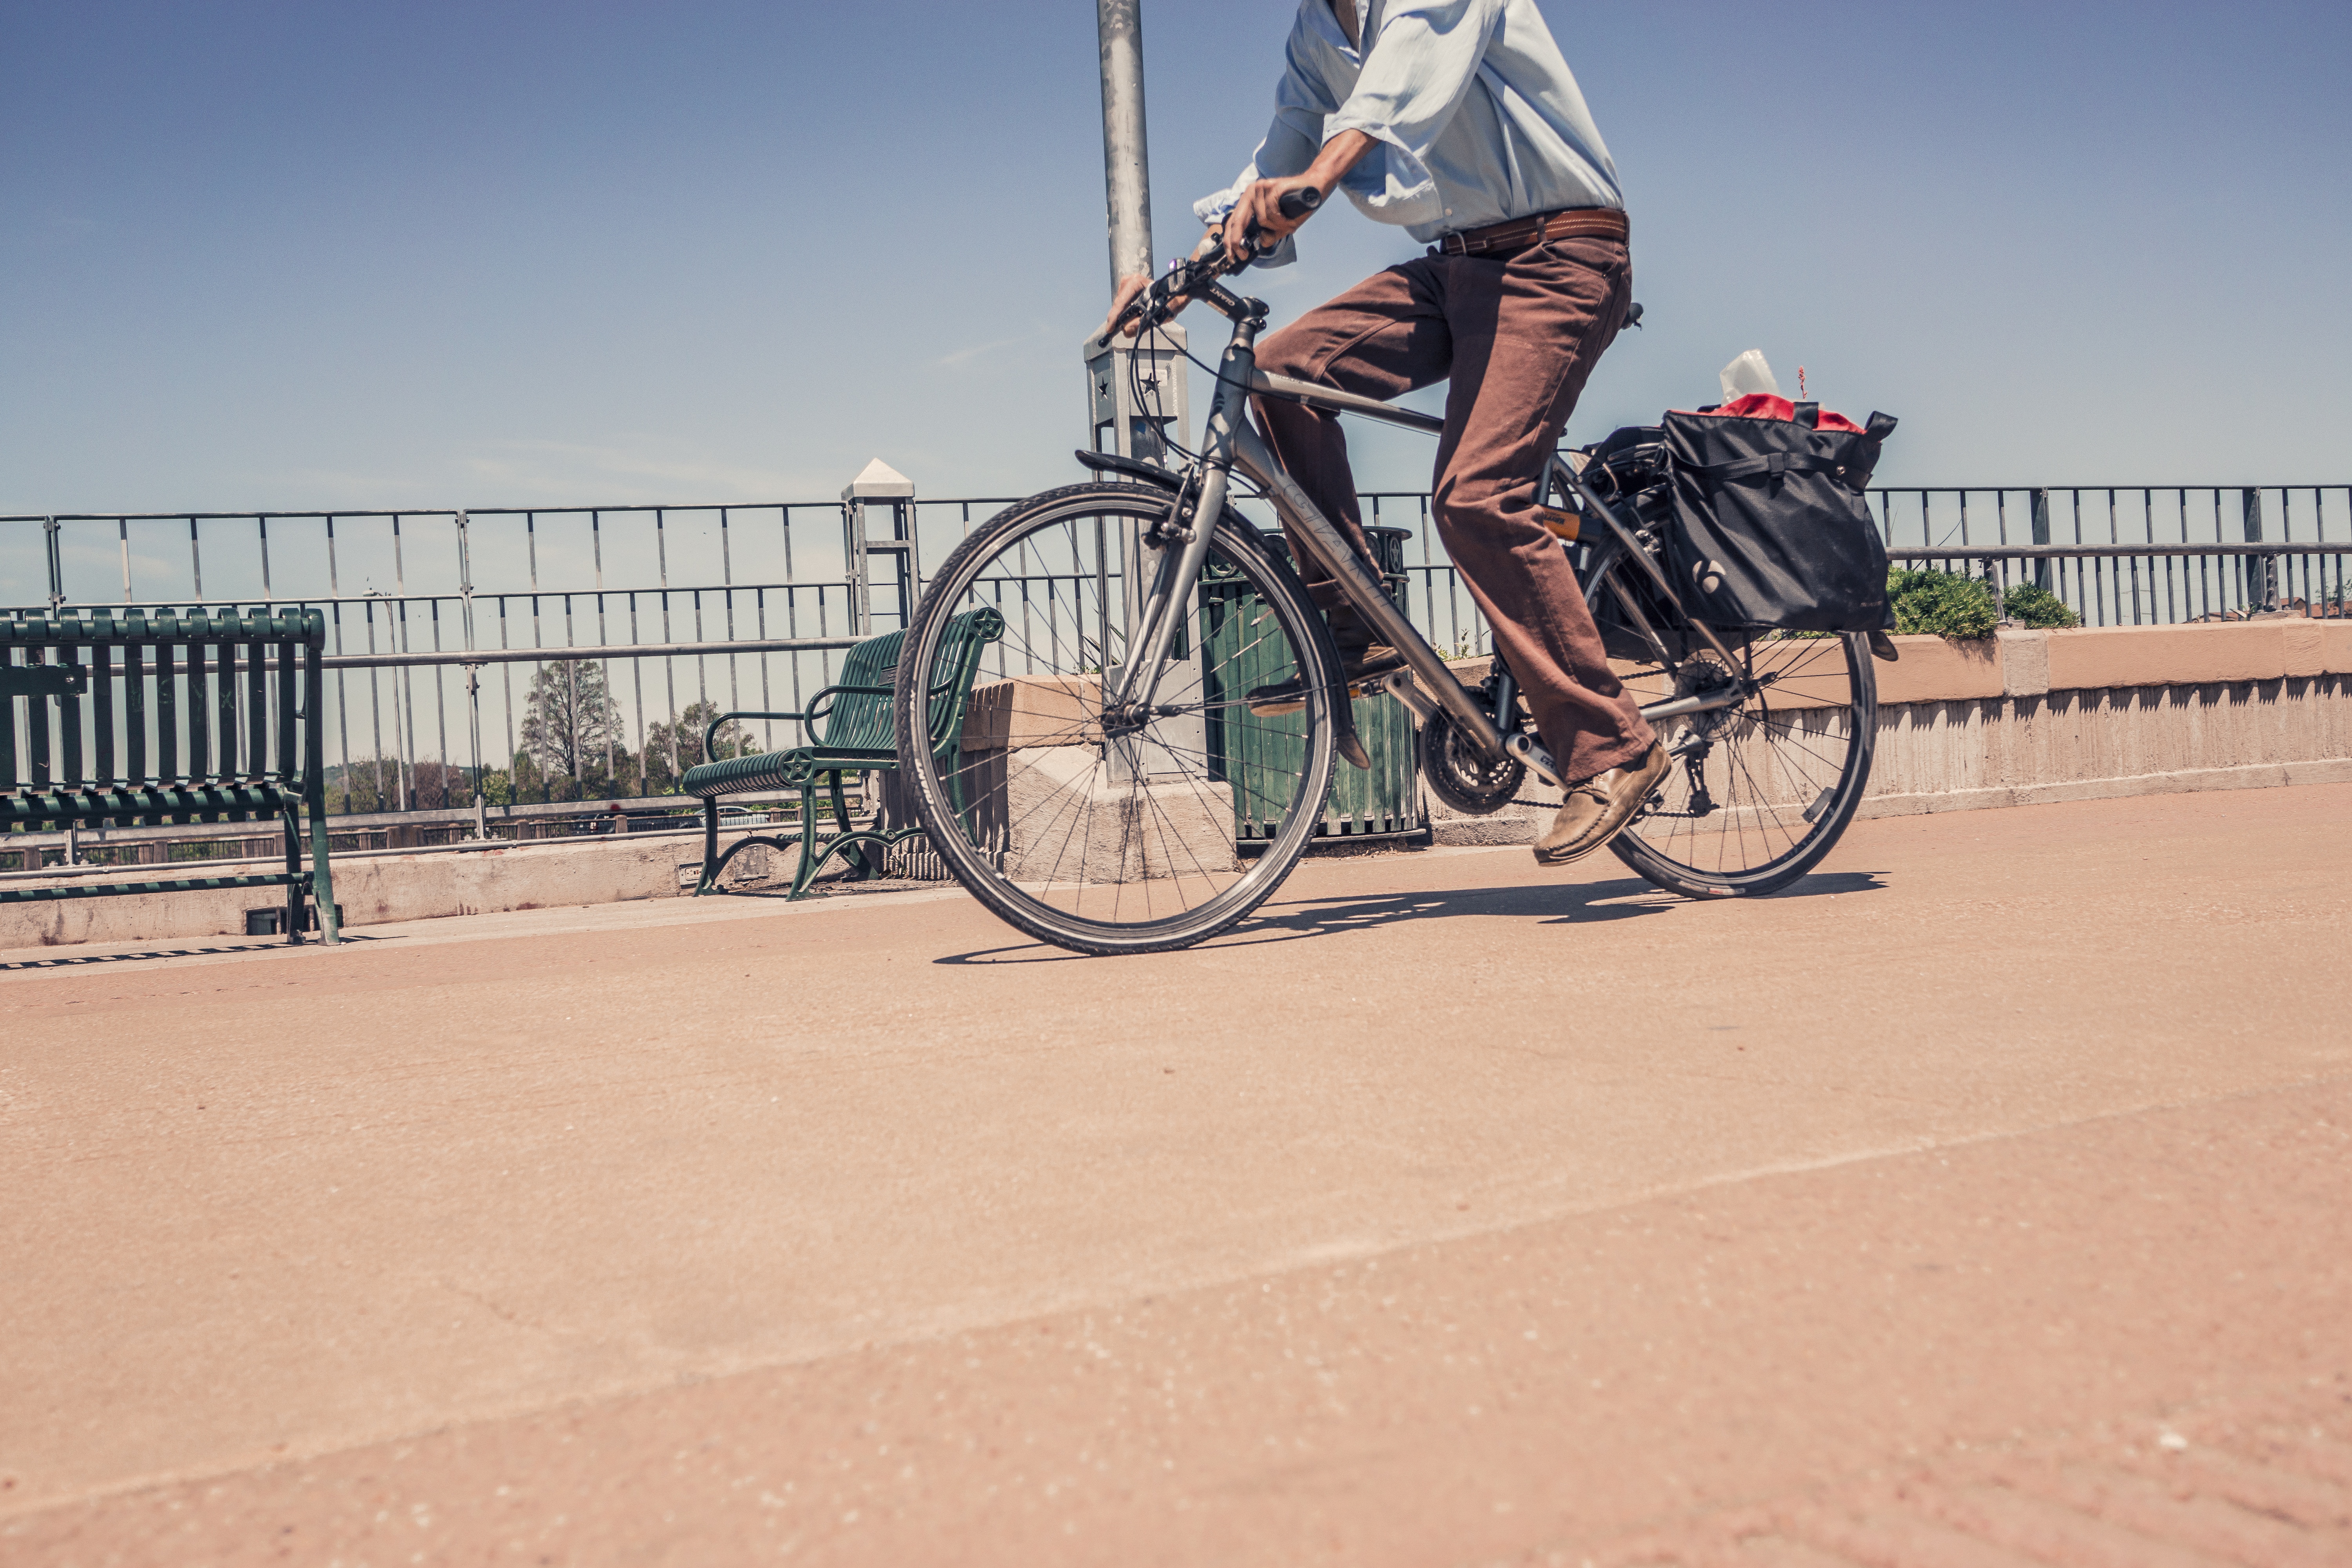
• 77% of households own at least one car.
• 86% of people who have a car in their household, use it at least once a week.
• Households without a car travel on average, 2,836 miles per year. Whereas, households with a car are likely to travel 7,282 miles per year.
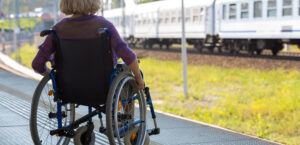
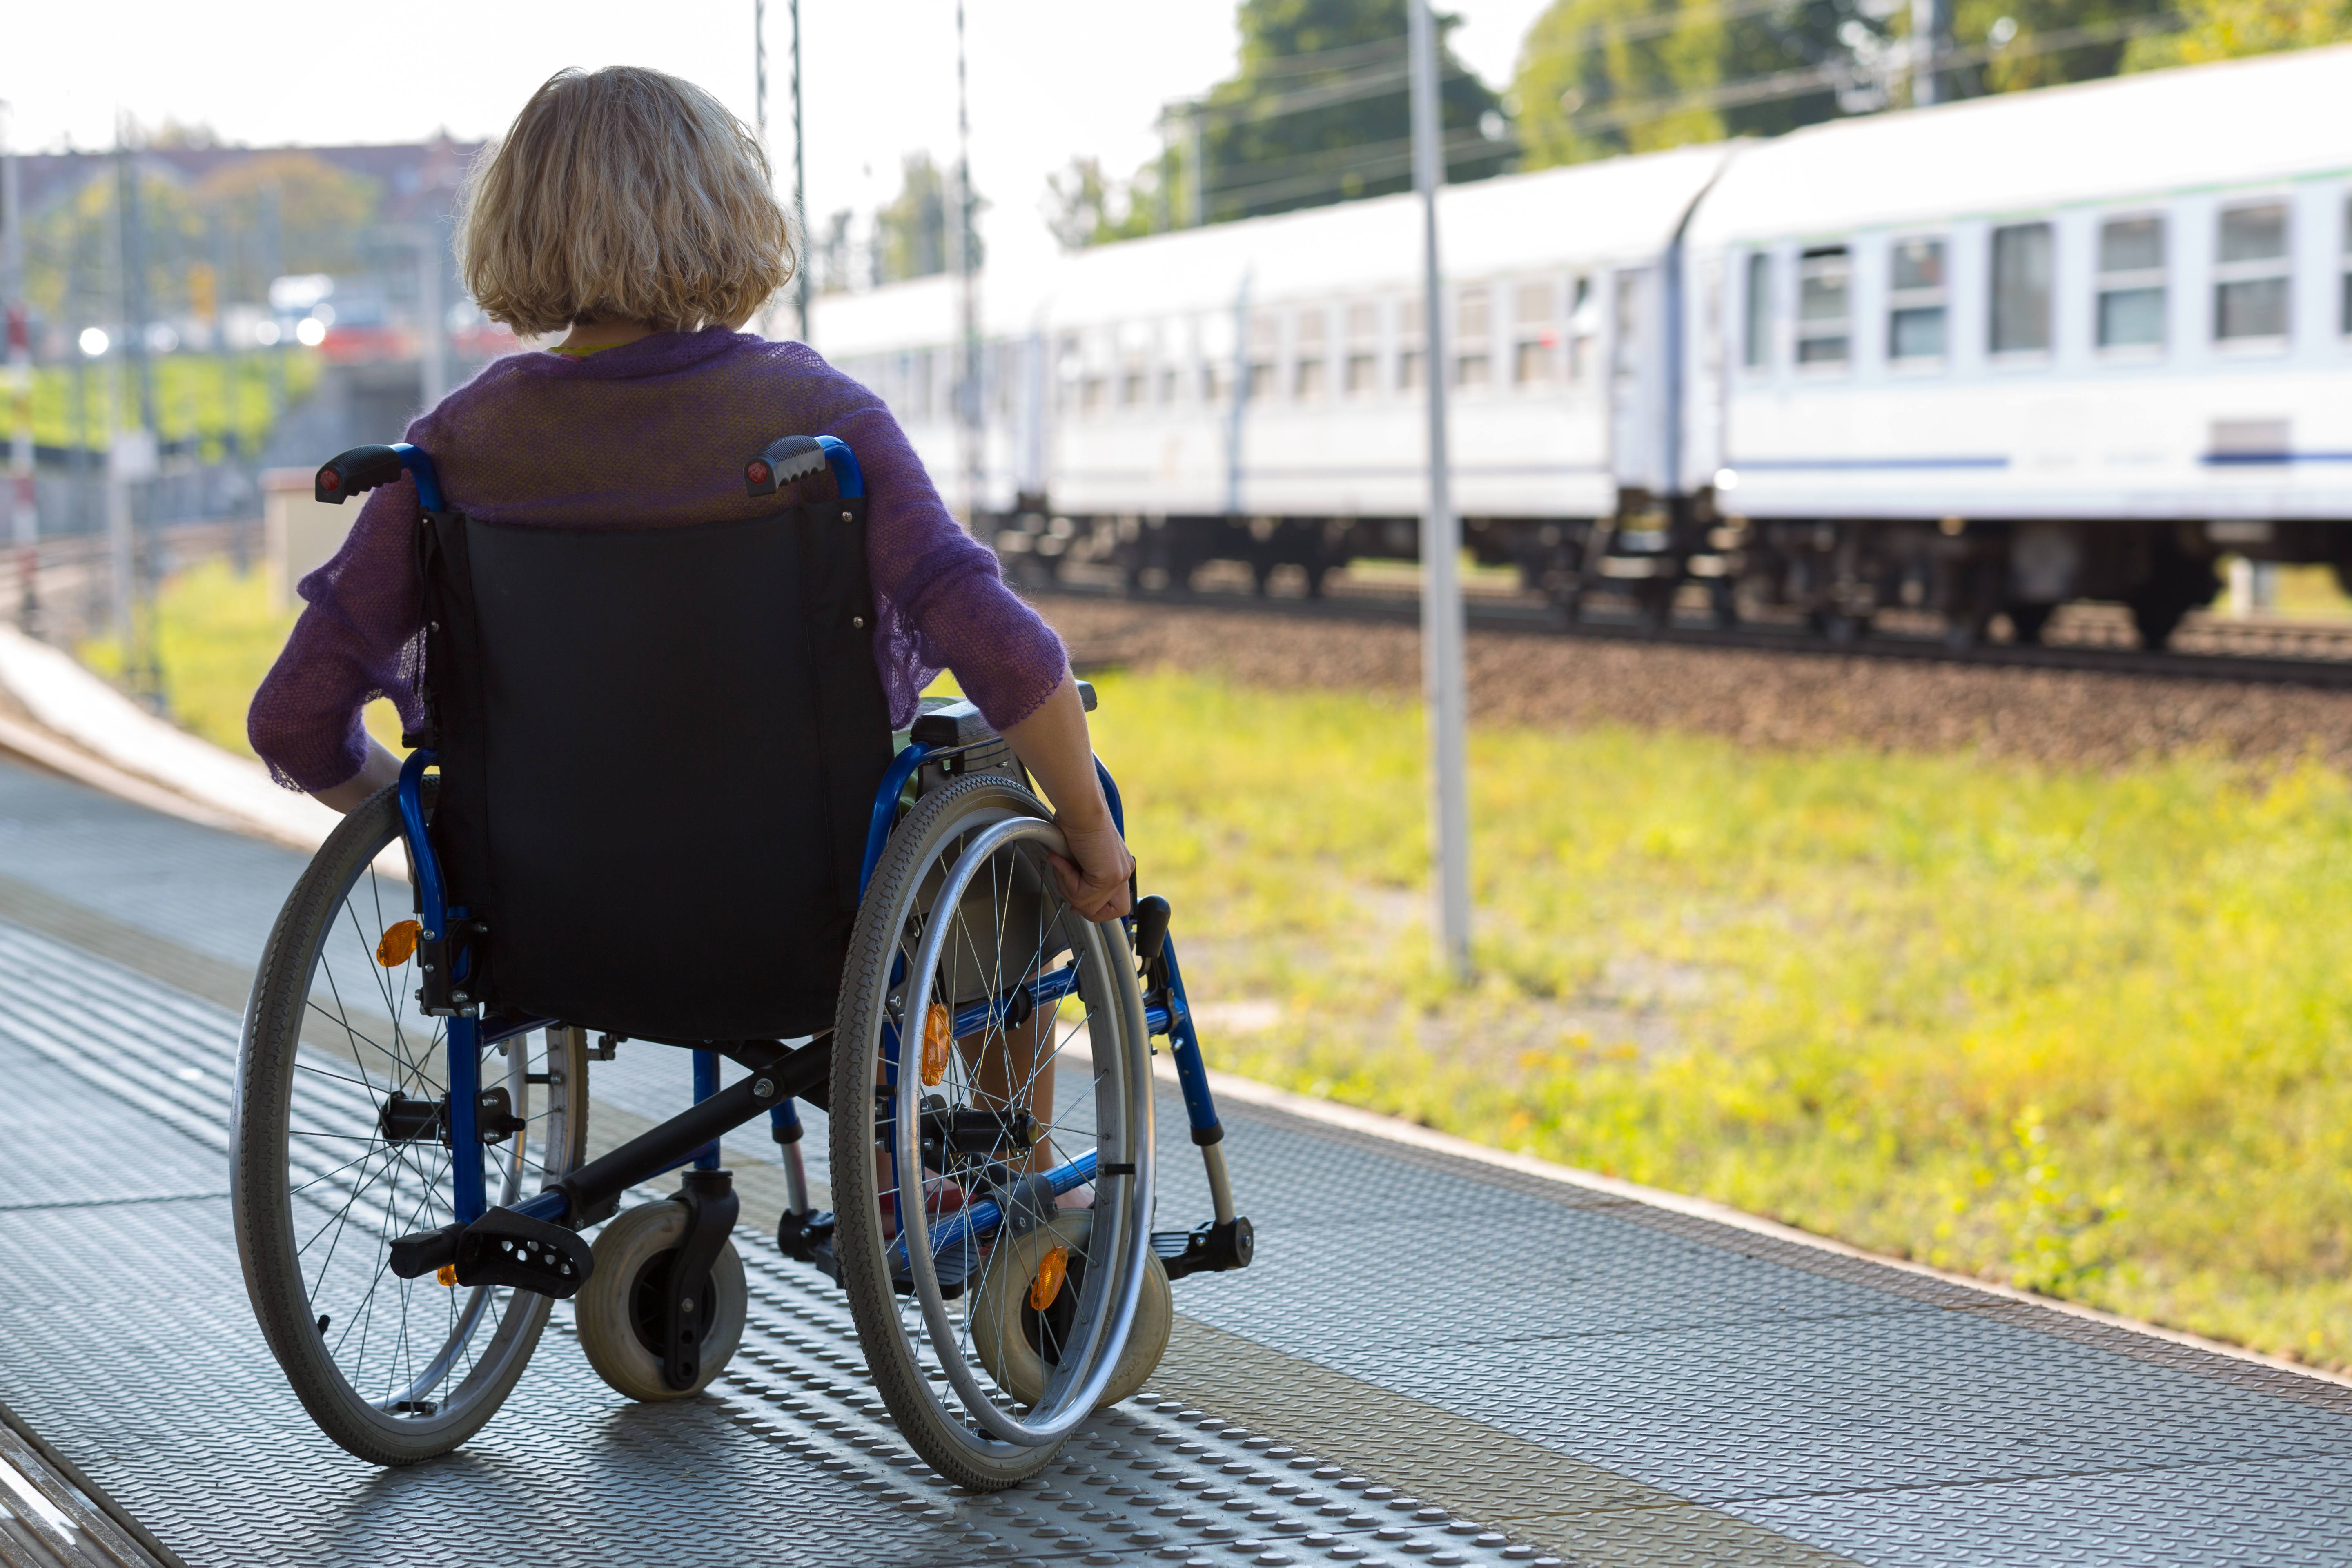
• If a household has no access to a car, the most common way of taking a journey is by walking.
• 73% of the English population have a driving licence (17+ years).
• 64% of commuting trips are made by car or van.
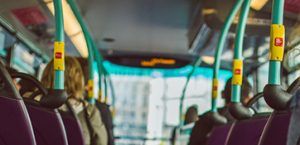
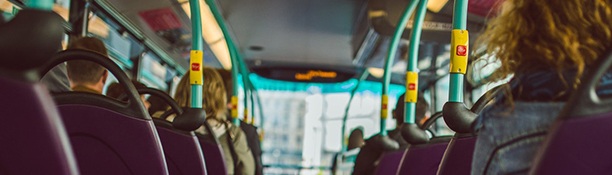
• The average amount of bus trips per individual was 52 per year.
• The average amount of miles travelled by bus was 291.
• Women are more likely to use buses.
• The majority of bus journeys are taken by school aged children.
• 21 surface rail trips are taken per person, per year on average.
• The average distance travelled is 538 miles.
• 48% of surface rail trips are for commuting purposes.
• 23% of rail trips are for leisure purposes and 10% are for business trips.
• Men are more likely to use train services.
The second report is due to be released later this year by the Department for Transport which will give further explanation on travel choices. You can see the full travel survey results here in the meantime.


Get the latest updates regarding our services.


Smarter Travel Limited.
Registration No. 09513648.
England, 847 The Crescent, Colchester, CO4 9YQ.
VAT reg: 249134404.